You may wonder what you stumbled upon. This is the humble work of some hardworking Creative Technologists that present you their data vizualisation for the course Data Vizualisation for CreaTe. With this data visualization we want to address some of the problems in the modern world when it comes to basic sanitation and need for clean drinking water.
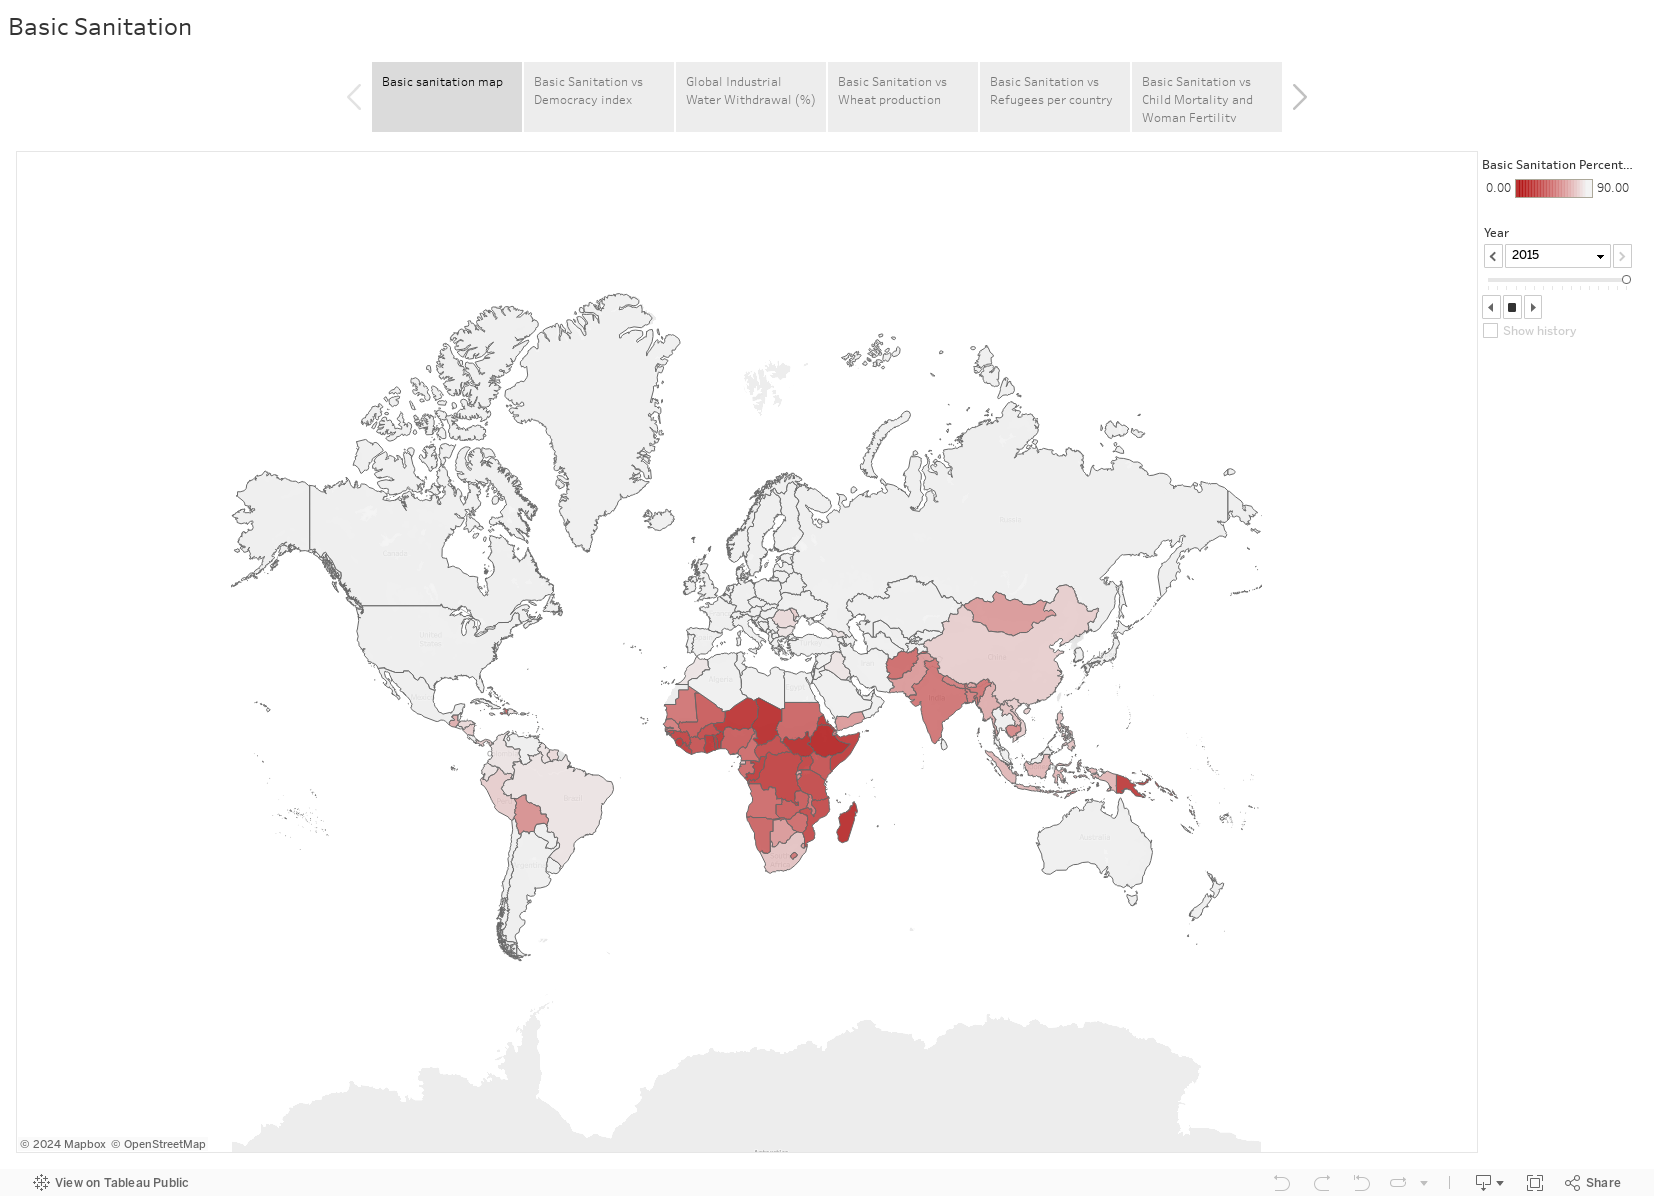
Let's first have a look at the global access to basic sanitation per country over the past years. As can be seen, actually a lot of countries are doing quite good, with a percentage of 85 and onwards. Sadly, however, there are some countries, especially in Africa, eastern Asia and South America that still have a lot of problems with this. It means that the residents of these countries do not have guaranteed access to clean drinking water, together with primary sanitary facilities. In some of these countries, even less than 10 percent of the people have access to clean drinking water! That's a real problem, whether we like to admit it or not.
What cause can there be for bad sanitation access? Could it be from the political situation in that particular country? We tried to find that out by plotting the basic sanitation access against the political index score, based on Wikipedia's democracy index. There looks to be a strong correlation between the state of democracy in a country and its basic sanitation overall for the population. It seems to be that democratic countries have more access to basic sanitation than countries that are less democratic.
It is interesting to look at the clean drinking water that goes to the improvements of industry, related while keeping the previous sheet in mind. Some of the countries that already have very limited access to clean drinking water, tend to even use this to improve their industries, without giving it to the people first. The Republic of Congois a nice - Or not so nice - example of that. While at maximum only around 15 percent of the population having access to basic sanitation, almost a quarter of that clean water is used for industry purposes. One might argue that these industry investments make a country grow, but is it really worth it if 85% of your population is not even having clear drinking water?
Let's dive further into the industry. In order to produce wheat and thus give people food, one needs water. A lot of water. Hence, when this water is available, one can start feeding their people. In this graph, a couple of countries in need of basic sanitations and a ouple countries that already have them are highlighted, with their basic sanitation plotted against the tonnes wheat the country produces per hectare. From this graph, it can be concluded that having more basic sanitations makes better opportunity for growing and producing wheat, indicating the need for good basic sanitary facilities.
A country that does not have their primary life requirements in order, probably isn't that popular, even with its own population. We wondered whether this could be seen in the access to water and if there were a lot of refugees fleeing the country. And actually, there seems to be a correlation. More of the countries on the left - hence, countries with less sanitary satisfaction - tend to have more refugees than the countries that do have good sanitary facilities, together with clean drinking water. There seems to be one big outlier, however, and that is Albania. This can be justified by looking at the fact that Albania is currently involved in a lot of corruptcy because of war, according to an official statement of Albanian refugees in the Washington Post.
Again, some first world together with some third world countries were chosen to compare the difference between the countries that have good sanitations and countries that have not. As we all know to be true, bad sanitation can affect a population's health in a very bad way. Diseases like diarrhea, cholera and hepatitis A all come from dirty water and bad sanitations, since the bacteria that cause these diseases need water to spread. In the current sheet, you can see two characteristics of countries with bad sanitation: child mortality rate (meaning the rate of children under the age of five dying), and fertility rate (the average amount of children per woman). As can be seen over the years, a lot of countries are improving on sanitation access, child mortality and fertility. This could means that if a country were to improve its sanitation access per person in their country, less people would die and thus less children need to be produced. By both deminishing the death rate of children under five years old and the amount of children being born per woman, people can go focus on improving their lives rather than surviving them.
Jan Water
Jonne Schoneveld - s1735748
Niels van Dalen - s1830988
Peter van der Burgt - s1838954
Emiel Steegh - s1846388
Harald Eversmann - s1840428
[1]
People using at least basic sanitation services (% of population)
[2]
Annual freshwater withdrawals, industry (% of total freshwater withdrawal)
[3]
Wheat yield in tonnes per hectare
[4]
Refugee population by country or territory of origin
[5]
Democracy Index of the countries of the world
[6]
Gapminder, dataset: Industrial Water Withdrawal as a % of Total Water Withdrawal